New Copernicus HR Vegetation Phenology & Productivity (HR-VPP) service
Copernicus Land Monitoring Service (CLMS) data play an important role in the monitoring and management for the growing demands for ambitious environmental targets across Europe.
Last week, we proudly released the new CLMS HR-VPP product. This high spatial and temporal resolution land monitoring dataset, will enable a better monitoring of vegetation dynamics and allow the assessment of climatic as well as anthropogenic impacts on ecosystems.
It covers the years 2017-2020 and will be updated yearly from 2022 onwards.

Figure 1: Seasonal variability in vegetation index across an agricultural landscape in Landen, Belgium.
What is the High-Resolution Vegetation Phenology and Productivity service?
Phenology is one of the key components of life on Earth, describing the ability of living organisms to adapt to environmental resources, and relating to growth and reproduction. It's a key bio-indicator of ecosystems.
The pan-European High-Resolution Vegetation Phenology and Productivity (HR-VPP) provides a new product suite with three product groups at a high spatial detail (10 m x 10 m), derived from the Sentinel-2 satellite constellation (Sentinel-2A and Sentinel-2B),
- four different Vegetation Indices (VI) record the status of the vegetation for every 10m pixel within 12 hours after observation. These products are targeted for use by experts due to their irregular time-interval and huge amount of data.
- Seasonal Trajectories (ST), like the vegetation indices, show the status of the vegetation, but at a regular time-interval of 10 days, and any gaps in the observations due to clouds or other disturbances being filled. They are targeted for use by novice users able to deal with time-series data.
- Vegetation Phenological and Productivity parameters (VPP) provide yearly metrics for up to two growing seasons, such as e.g. start or end of the growing season, season length, seasonal productivity, etc. The VPP parameters are targeted for novice users.
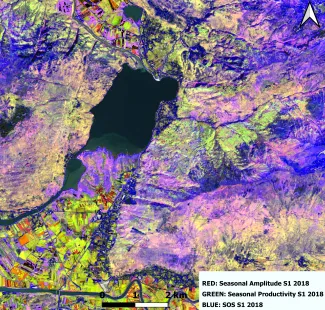
Figure 2: False Colour Composite made up from three phenology parameters, illustrating variability across a landscape around Lago di Mezzola, Italy.
The HR-VPP product suite is generated over the entire EEA39 region (33 member countries and 6 cooperating countries) for the period January 1 2017 onwards.
What is the HR-VPP data used for?
Plant phenology is among the most important species traits, describing seasonal events such as leaf emergence, bud burst, leaf unfolding, flowering, and leaf senescence. Birds plan their nesting such that eggs hatch when insects are available to feed nestlings, and insect emergence is often synchronized with leaf out in host plants. Phenology also determines migration patterns of fauna in order to exploit favourable climatic conditions or to avoid unfavourable ones. Earlier flowering also poses health issues to people dealing with allergies. Farmers and gardeners need to know the schedule of plant and insect development to decide when to apply fertilizers and pesticide and when to plant to avoid frosts.
Phenology influences the abundance and distribution organisms, ecosystem services, food webs and global cycles of water and carbon. In summary, phenology provides an integrated measure of ecosystem responses to climatic factors as well as to human induced disturbances, and hence have a strong potential to monitor the condition and degradation of ecosystems.
With its wide application the HR-VPP product will increase the potential of the Copernicus Land Monitoring Service to increase the potential to serve policy requirements such as the Biodiversity Strategy 2030, the Common Agriculture Policy (CAP), Climate initiatives such as the LULUCF regulation for 2021-2030, the Urban Agenda, the Circular Economy policies of the EU as well as the UN Sustainable Development Goals (SDG's).
How is the HR-VPP data generated?
Vegetation phenology addresses periodic plant life-cycle events such as emergence, flowering and bud-burst (in spring) and leaf coloration and fall (in autumn). These events can be observed in the field, but typically only at the individual plant, species or plot level. At larger scales, we can rely on time series of satellite based vegetation indices. These indices, typically derived from optical satellite imagery such as provide by Sentinel 2, address the vigour of green biomass and allow the differentiation of the intensity of photosynthetic activity. This in turn depends on the plant functional types and vegetation dynamics during the growing season. The continuous stream of daily Vegetation Indices provides an update of the vegetation status across the European continent every 5 days and enables us to continuously monitor the ecosystems health at large detail. This stream of data is turned into yearly maps to support quick assessments for all ecosystem types (forest, grassland, etc.)
The product represents the ground-truth through having undergone a full calibration campaign using in-situ ground data from phenological cameras and carbon flux towers, and manual ground observations of phenology and agricultural events.
Where to find the data?
The HR-VPP data is stored on the WEkEO cloud. Users can freely view and download the data through the WEkEO portal.
Other products from the 4 Copernicus services focused on environmental data (marine, atmosphere, climate and land) are available on the same platform.
In the coming months, the HR-VPP service will release a set of tools that support dealing with the big dataset. So keep an eye on it!
VITO (Belgium) is the prime contractor of the HR-VPP consortium together with Lund University (Sweden), ZAMG (Austria), EOLAB (Spain) and with support from Malmö University (Sweden) and KHufkens Consulting (Belgium).