Fresh data and upgrade for ‘How green is your municipality’
Classifying your municipality with Sentinel-2 satellite data
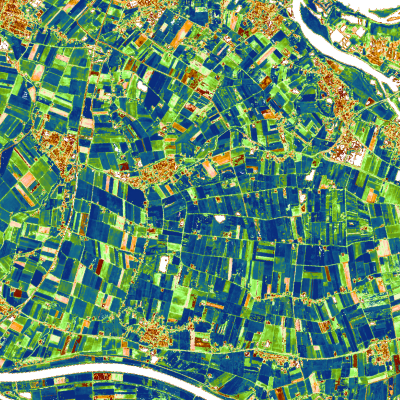
The application ‘How green is you municipality?’ has been updated with more recent satellite data and innovative image analytics. The online platform, released as a demonstrator via Terrascope in 2018, shows a basic classification of your municipality based on all satellite data captured by the Sentinel-1 and Sentinel-2 satellites in 2019.
Discover how many km² of your municipality is green, agriculture, water or sealed area. Search for your municipality to see how green it actually is or compare it with other Belgian municipalities. It is free and open to use, and available in three languages.
“Additional satellite data and the use of AI on the Terrascope platform enabled fresh and objective insights into the Belgian municipalities. This enables citizen-level follow-up on the evolution of local natural capital.”
The new and updated platform uses Earth observation data from the Copernicus Sentinel satellites (2019) in addition to other reference data sets (eg an elevation model) and training data. We combine these data sets with new and innovative artificial intelligence techniques to obtain a classification of 10 land cover classes which were then reduced to the 4 classes previously used in the first viewer.
The platform is a clear example to show the true value of satellite data. By using Earth observation data and state-of-the-art image processing technology we can provide objective information about our environment, society and economy, hereby supporting governments and businesses to plan a path towards sustainable growth.

