From Existing Crop Maps to Training Samples: Leveraging Local Crop-Mapping Initiatives to Strengthen WorldCereal’s Global Crop Mapping
Every season, farmers grow calories, not just crops. But to know how much food is being produced, or how climate, conflict, or drought are affecting it, we need to know what is growing where. Up-to-date and accurate crop maps are crucial in informing decisions about food security, water use, subsidies and more. Today, freely available satellite data (for example from the European Copernicus program), in combination with machine learning techniques, makes it possible to produce high-resolution crop type maps almost anywhere and at any time, covering many different crops and seasons. Yet, to train accurate crop identification algorithms, researchers rely on crop observations collected through field surveys, which are costly and typically performed by different organisations, which results in scattered, heterogeneous and typically closed data. This lack of solid reference data is one of the main barriers to building accurate, global crop type maps.
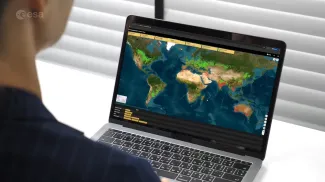
In this blog post, Lucile Jam explains how the WorldCereal project, funded by the European Space Agency (ESA), tries to bridge this gap. Lucile Jam is a master’s student in Applied Mathematics. She completed a six-month internship at ESA, where she worked on the WorldCereal project in collaboration with VITO and Wageningen Environmental Research, contributing to the use of existing crop type maps to address reference data scarcity.
To reduce this gap in trustworthy reference data, WorldCereal's Reference Data Module (RDM) brings together as much publicly available data as possible in one place. Figure 1 shows the current distribution of datasets. In parallel, many crop type maps have already been produced and made public. But these maps are not as reliable as ground-truth data: their quality, resolution and accuracy can vary widely. Therefore, the objective of this work has been to set up and apply a robust procedure that samples training points from high-quality crop/land-cover maps, and to explore how it could help strengthen crop mapping accuracies in regions where field data is scarce or completely missing.
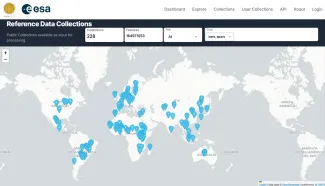
Figure 1: Distribution of datasets currently available in WorldCereal’s Reference Data Module, including newly integrated map-derived samples produced in this work.
The Current Landscape of Crop Type Maps
To identify potential sources of training data, we first reviewed the existing landscape of crop type maps. A study by Zhang et al. (2025) provided a useful starting list of existing crop maps. We expanded it through online searches, government and space agency websites, literature references and contacting authors, using translation tools when necessary for non-English sources.
In total, we inventoried 59 different sources, noting their spatial resolution, geographic coverage, crop classes, available years, accuracy metrics, licence terms, and whether they included quality assurance flags or label confidence scores (Table 1). Many maps, however, were not publicly accessible or lacked sufficient accompanying information to be further processed. This review revealed major differences in map quality and accuracy reporting: some provided detailed crop class information but limited accuracy reporting, while others reported high overall accuracy but lacked per-class metrics or precise temporal information. Regional availability also varied widely, with many datasets in regions like China, but far fewer in the rest of Asia and Africa.
This evaluation helped determine which maps could be trusted and where extra caution was needed.
Table 1: Full inventory of the crop map sources we reviewed, including regions, crop types, years covered, spatial resolution, reported user accuracy information (averaged within each source), source and licence terms.
| REGION | CROP TYPES |
YEARS(S) | SPATIAL RESOLUTION |
UA (AVERAGE) |
CLASS- SPECIFIC ACCURACY? |
SOURCE | LICENCE |
|---|---|---|---|---|---|---|---|
| South Korea |
rice | 2017-2021 |
10m |
0.96 (*) |
yes |
H. Jo et al., 2022 |
CC BY 4.0 |
| Argentina (northeast) |
multiple | 2018-2024 |
30m |
(***) |
yes |
D. Abelleyra et al. |
CC BY 4.0 |
| China (northeast) |
maize, soybean, rice |
2017-2019 |
10m |
0.84 |
yes |
N. You et al., 2021 |
CC BY 4.0 |
| China | winter wheat |
2020-2022 |
10m |
0.92 |
yes |
G. Yang et al., 2023 |
unknown (contacted by email) |
| Brazil | multiple | 1985-2023 |
30m |
0.89 |
no |
MapBiomas | CC BY |
| China | maize, soybean |
2019 |
10m |
0.78 |
yes |
H. Li et al., 2023 |
unknown |
| China | maize | 2017-2021 |
10m |
0.93 |
yes |
X. Li et al., 2023 |
CC BY 4.0 |
| South America |
soybean | 2001-2023 |
30m |
0.89 |
yes |
X. Song et al., 2021 |
unknown |
| China | soybean | 2017-2021 |
10m |
0.75 |
yes |
Q. Mei et al.,2023 |
CC BY 4.0 |
| Southeast & Northeast Asia |
rice | 2017-2019 |
10m |
0.88 (**) |
yes |
J. Han et al., 2021 |
CC BY 4.0 |
| China | rice | 2017-2022 |
10-20m |
0.73 |
yes |
R. Shen et al., 2022 |
CC BY 4.0 |
| Southeast Asia |
rice | 2019 |
20m |
0.92 |
yes |
C. Sun et al., 2023 |
CC BY 4.0 |
| North America, Chile, Europe |
rape- seed |
2017-2019 |
10m |
0.91 |
yes |
J. Han et al., 2021 |
CC BY 4.0 |
| China (Xinjiang) |
cotton | 2018-2021 |
10m |
0.95 |
yes |
X. Kang et al., 2023 |
CC BY 4.0 |
| China | rape- seed |
2000-2022 |
30m |
0.94 |
yes |
W. Liu et al., 2023 |
CC BY 4.0 |
| China | winter wheat |
2000-2023 |
30m |
0.92 |
yes |
G. Yang et al. 2025 |
CC BY 4.0 |
| China (Yangtze River Economic Belt) |
rape- seed |
2017-2021 |
10m |
0.97 |
yes |
W. Liu et al. 2023 |
CC BY-NC-ND 4.0 |
| China | rape- seed |
2017-2021 |
20m |
0.94 |
yes |
Y. Zang et al. 2023 |
CC BY 4.0 |
| China (North China Plain) |
winter wheat |
2013-2022 |
30m |
0.90 |
yes |
Y. Liu et al. 2024 |
CC BY |
| China | winter wheat |
2001-2020 |
30m |
0.92 |
yes |
J. Dong et al. 2024 |
CC BY 4.0 |
| Vietnam | multiple | 2020 |
10m |
0.90 |
yes |
JAXA v23.09 | JAXA’s "Terms of Use of Research Data" |
| Vietnam | multiple | 1990-2020 |
30m |
0.85 |
yes |
JAXA v21.09 | JAXA's "Terms of Use of Research Data" |
| China (Huang- Huai-Hai Plain) |
winter wheat |
2018-2022 |
10m |
0.97 |
yes |
J. Hu et al., 2024 |
CC BY-NC-ND 4.0 |
| US | multiple | 1997-2024 |
30m |
(***) |
yes |
USDA | public domain |
| Japan | multiple | 2018-2020 |
10m |
0.90 |
yes |
JAXA v21.11 | JAXA's "Terms of Use of Research Data" |
| Japan | multiple | 2018-2020 |
10m |
0.86 |
yes |
JAXA v21.03 | JAXA's "Terms of Use of Research Data" |
| Japan | rice | 2015-2019 |
30m |
0.85 |
yes |
L. Carrasco et al., 2022 |
CC BY 4.0 |
| Brazil | sugar- cane |
2016-2019 |
30m |
0.94 |
yes |
Y. Zheng et al., 2022 |
CC BY 4.0 |
| Vietnam | multiple | 2015-2018 |
50m |
0.74 |
yes |
JAXA v19.08 | JAXA's "Terms of Use of Research Data" |
| Southeast Asia |
rice | 2020-2021 |
10m |
0.92 (**) |
yes |
F.I. Ginting et al., 2024 |
CC BY 4.0 |
| Asia | rice | 1990-2023 |
30m |
0.90 |
yes |
S. Li et al., 2025 |
CC BY-NC-ND 4.0 |
| Uruguay | multiple | 2019-2022 |
10m |
0.95 (*) |
no |
SIT | Open Data License - Uruguay |
| Senegal | multiple | 2020 |
10m |
0.76 |
yes |
M.K. Gumma et al., 2024 |
CC BY |
| East Asia | rice | 2023 |
10m |
0.91 |
yes |
M. Song et al., 2025 |
CC BY 4.0 |
| Japan | multiple | 2020, 2022, 2024 |
10m |
0.94 |
yes |
JAXA v25.04 | JAXA's "Terms of Use of Research Data" |
| Japan | multiple | 2022 |
10m |
0.95 |
yes |
JAXA v23.12 | JAXA's "Terms of Use of Research Data" |
| Japan (Okinawa island) |
multiple | 2020 |
10m |
0.90 |
yes |
JAXA v23.01 | JAXA's "Terms of Use of Research Data" |
| Honduras | multiple | 2024 |
10m |
0.92 (*) |
no |
ICF | publicly downloadable |
| Uruguay | multiple | 2022 |
10m |
not |
no |
DGRN, MGAP - OAN |
Free to use, citing DGRN, MGAP as the source. |
| Ethiopia | maize | 2016-2019 |
10m |
not |
no |
Azzari et al. 2021 |
CC BY 4.0 |
| Southeast Asia, West Africa, Central America |
oil palm | 2019 |
10m |
0.87 |
yes |
A. Descals et al. 2021 |
CC BY 4.0 |
| Southeast Asia |
rubber | 2021 |
10m |
0.99 |
yes |
Y. Wang et al., 2023 |
CC BY 4.0 |
| Ghana, Ivory Coast |
cocoa | 2019-2021 |
10m |
0.926 |
yes |
N. Kalischek et al., 2023 |
CC BY 4.0 |
| Philippines, Indonesia, India |
coconut | 2020 |
20m |
0.79 |
yes |
A. Descals et al., 2023 |
CC BY 4.0 |
| China (Hetao district) |
multiple | 2020-2021 |
10m |
0.95 (*) |
yes |
G. Li et al., 2022 |
data available on request, no licence cited |
| Global | winter triticeae |
2017-2022 |
30m |
0.88 |
yes |
Y. Fu et al., 2025 |
CC BY 4.0 |
| Nigeria (Jos Plateau) |
maize, potato |
2019-2020 |
10m |
0.87 |
yes |
M. S. Ibrahim et al., 2021 |
CC BY 4.0 |
| Global | sugarcane | 2019-2022 |
10m |
0.67 |
yes |
Di Tommaso et al., 2024 |
CC BY 4.0 |
| China | winter wheat |
2016-2018 |
30m |
0.90 |
yes |
J. Dong et al., 2020 |
CC0 1.0 Universal |
| Bangladesh, Northeast India |
rice | 2017 |
10m |
0.90 |
yes |
Singha et al., 2019 |
CC BY 4.0 |
| Vietnam (central region) |
multiple | 2017 |
10m |
0,.89 |
yes |
JAXA v18.07 | JAXA's "Terms of Use of Research Data" |
| Vietnam (southern region) |
multiple | 2017 |
10m |
0.79 |
yes |
JAXA v18.09 | JAXA's "Terms of Use of Research Data" |
| Costa Rica | palm oil, pineapple |
2018-2019 |
10m |
0.98 (*) |
yes |
CeNAT | Copyright reserved |
| East Africa | multiple | 2022 |
10m |
0.91 |
yes |
A. Liepa et al., 2024 |
data available on request, CC BY 4.0 |
| China | sugarcane | 2016-2020 |
30m |
0.88 |
yes |
Y. Zheng et al., 2022 |
data available on request, CC BY |
| Ethiopia | multiple | 2021-2022 |
10m |
0.85 |
yes |
C. Eisfelder et al., 2024 |
data available on request, CC BY |
| Pakistan | multiple | 2021 |
30m |
0.85 |
yes |
W. Yousaf et al., 2025 |
data available on request, CC BY 4.0 |
| Uzbekistan | cotton | 2018 |
10m |
0.85 |
yes |
J. Jaloliddinov et al., 2023 |
data available on request, CC BY |
| Brazil | rice | 2019-2020 |
10m |
0.94 |
yes |
A. S. Fernandes Filho et al., 2024 |
data available on request, CC BY |
(*) Overall Accuracy (OA) reported instead of User’s Accuracy (UA), as UA was not available.
(**) R² reported, as UA and OA were not available.
(***) Class-specific UA is reported for each crop, region and year; a single value is therefore not provided.
(a) No accuracy metrics were reported, confidence was assessed through comparison with another crop map listed in this table.
Bold entries indicate crop type maps retained for sampling in this study.
From Crop Type Maps to Reliable Training Samples
Because the quality and resolution of crop maps can vary widely, we built a structured procedure to extract only the most reliable training points (see also Figure 2).
A 6-Step Sampling Workflow
- Pre-filter maps:
We focused on recent maps (2017 onwards) and prioritised high spatial resolution, in particular 10 m maps. Given the existing availability of land cover reference data, we prioritised sources providing crop type information, while still retaining land cover classes when they were included in the original datasets. We mostly kept maps that covered regions where in-situ reference data is scarce such as South America, Asia, and Africa, and that reported high accuracy, preferably per-class user accuracy above 85%.
- Confidence and agreement:
We prioritised maps with pixel-level confidence scores, so we could sample from the most certain pixels. When several good maps existed for the same crop (for example, five maps for winter wheat in China), we overlaid them and only kept the pixels where most maps agreed, creating in a way our own confidence layer.
- Noise control:
Before sampling, we applied an erosion step, removing a few pixels along the borders of crop patches (for example, two pixels), with the exact number depending on the quality of each map. This avoided edge pixels, where crops often mix with roads, trees, or other land use, and excluded very small or isolated fields. This way, we sampled from the more reliable field interiors.
- Spatial and temporal stratification:
To avoid geographic bias, we divided the study area into H3 hexagonal cells, a global grid system developed by Uber that subdivides the Earth into hexagons of different sizes. Each cell can be split into finer “child” cells, which allowed us to adapt the resolution scale of the region. In practice, we used larger cells in very big areas and smaller ones in more detailed studies, always allocating a fixed number of samples per cell to ensure balanced spatial coverage. In some cases, we limited sampling to the main production zones for a crop, based on external references such as SPAM maps or USDA statistics (for example, maize in China is concentrated in the northeast), so that points were sampled from realistic growing areas.
- Class balance with caps:
We set per-class quotas and enforced a minimum distance between points so that no two samples came from the same field, reducing redundancy and spatial autocorrelation.
- Post-processing:
For some datasets, an additional post-processing step was applied to remove points that still fell on roads or buildings. This filtering was based on OpenStreetMap layers and helped eliminate noise that was not captured by the crop maps themselves. This step was handled by our WorldCereal partner Wageningen Environmental Research.
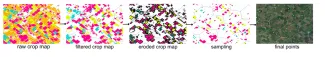
Figure 2: Workflow of the sampling procedure: from raw crop maps to final training points. Example shown with the INTA Argentina summer 2023 crop map.
By combining these steps (and keeping a full record of each sample’s source, class and filters), we created a curated set of training points that balanced accuracy, spatial coverage and class diversity.
Why Combining Multiple Crop Maps Matters
When multiple crop maps were available for the same crop and region, we intersected them to identify the most reliable areas before applying the sampling workflow described above. Although different maps may report high accuracy, they can still differ at the pixel level.
To illustrate this, we overlaid five independent winter wheat maps in China. While the main production areas appear consistent at first sight, pixel-level agreement metrics reveal some differences: pairwise overlap averaged 0.67 IoU (Intersection over Union) but agreement across all five maps dropped to 0.42 IoU and 0.25 F1 (weighted average of the precision and recall), highlighting spatial uncertainty despite similar region patterns.
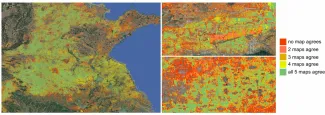
Figure 3: Agreement map of five winter wheat products in China. Green areas indicate strong agreement across maps, while red areas show disagreement.
These differences likely result from variations in input data, spatial resolutions and available reference data. By combining multiple maps, we can filter out noisy pixels and keep only the most reliable areas for sampling.
What Does the Resulting Dataset Look Like?
We processed a total of 113 maps, which after filtering covered 76 classes (62 crop types and 14 land-cover classes) across 17 countries. These were consolidated into 67 curated datasets. Here we use “dataset” to mean a unique combination of source, season, year and country.
Regionally, the balance is uneven: 37% of datasets come from Northeast Asia (with 21% from China alone) and 34% from South America. Africa, in contrast, is almost absent, with only a single dataset in Senegal (1.4%). This imbalance reflects both the availability of open crop maps and the challenge of building globally consistent datasets, and the additional difficulties of producing crop type maps in Africa: complex landscapes, limited reference data, and fewer local mapping initiatives.
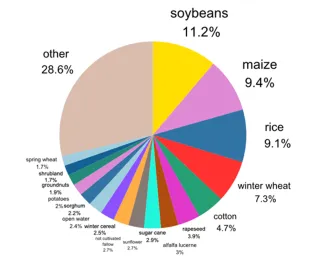
As shown in Figure 4, soybean, maize, rice, winter wheat, and cotton dominate our samples (together nearly 40%). We focused on these crops because they are widely mapped and central to global food production, while crops like rye, millet, and fruit types are much less represented. Figure 5 provides a global overview of the sampled points, showcasing how our efforts were able to resolve many of the existing spatial reference data gaps in the current WorldCereal system.
|
Figure 4: Distribution of sampled points by crop type. |
Figure 5: Global overview of WorldCereal reference data before and after the integration of map-based samples. |
As a final outcome of this work, these samples were integrated into WorldCereal's Reference Data Module (RDM), making them transparent, reusable and ready to support future crop mapping efforts.
Limitations of Crop Type Maps as Reference Data
One of the main lessons from this work is that even the best crop maps are not ground truth. They are valuable approximations, but they always carry uncertainty. For instance, even at 10-30 m resolution, a single pixel can cover a crop and a road, or a field and a farmhouse. Some products also tend to overpredict or underpredict, extending cropland into built-up or non-agricultural areas. In practice, this means that points we sample from crop maps sometimes fall just outside the real fields (see Figure 6).
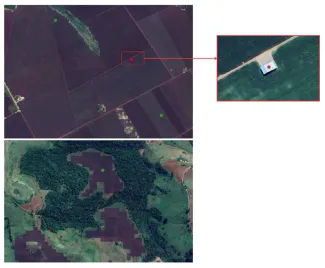
Figure 6: Example from the intersection of two soybean maps in Brazil (grey layer). Top: the map extends over a large area including roads and buildings. Some points still fall correctly inside fields (green), but others end up misplaced, one even on a farmhouse (red). Bottom: a cleaner case from the same intersection, where erosion helped ensure the point was well inside the field (green).
These limitations do not make crop maps useless, far from it. Their main advantage is the ability to sample a high number of points across large areas, something that is not often achievable with in-situ data alone. By carefully filtering, combining multiple products, and applying strict quality rules, we can extract training points that are far more trustworthy than using any map alone. But they will never fully replace in-field observations. Instead, they should be seen as a complement: filling gaps in places where ground data is missing, while reminding us that true reference data remains the gold standard.
Do Map-Based Samples Actually Help? Experimental Results
To evaluate the usefulness of map-based training samples, we ran a test in Argentina, a region where we already had high-quality in-situ reference data. This made it possible to validate model performance against a reliable ground-truth baseline. Argentina is also well suited for this analysis because multiple multi-year crop maps are publicly available.
We assembled four complementary datasets to reflect realistic training scenarios:
- Map-derived labels: a large number of samples with medium-label quality extracted using the sampling workflow described above.
- Local in-situ reference data from windshields surveys: a small number of samples with very high quality.
- European high-quality reference data: used to test cross-regional transferability.
- An independent hold-out dataset from windshields surveys: used exclusively for model evaluation.
By training models on different combinations of these datasets and evaluating them on the same high-quality test set, we assessed to what extent map-based labels can complement in-situ observations (Table 2).
As expected, local in-situ data alone yields the best performance (Scenario 1), reaching approximately 0.85 F1-score for maize and 0.76 for soybean.
When models are trained only on European samples (Scenario 2), i.e. data from a completely different agroecological context, performance drops substantially, highlighting the limits of cross-region transfer.
Training exclusively on map-based samples (Scenario 3 and Scenario 4) performs surprisingly well, particularly for maize. While these labels are noisier than in-situ observations, their large number and spatial coverage provide the model with sufficient diversity to learn crop-related patterns.
The most informative result emerges when map-based and in-situ data are combined (Scenario 5). In this setting, model performance matches the in-situ baseline for maize and comes close for soybean, while using only about half the number of in-situ samples.
|
Scenario |
Training Data Sources |
Maize F1 |
Soybean F1 |
|
1 |
500 in-situ samples per class |
0.85 ± 0.02 |
0.76 ± 0.01 |
|
2 |
500 EU samples per class |
0.47 ± 0.09 |
0.56 ± 0.13 |
|
3 |
500 map-based samples per class |
0.83 ± 0.01 |
0.67 ± 0.01 |
|
4 |
All map-based samples |
0.86 ± 0.01 |
0.67 ± 0.01 |
|
5 |
250 in-situ & 250 map-based samples per class |
0.86 ± 0.01 |
0.68 ± 0.01 |
Table 2: Crop classification performance in Argentina (F1- scores) for different training data scenarios.
Visual inspection over test sites in Argentina confirms these quantitative findings (Figure 7). Models trained only on European data (Scenario 2) perform poorly with strong confusion between crop types and poorly delineated fields. Models trained solely on map-based samples (Scenario 4) produce more coherent predictions, but results can remain noisy, particularly along field boundaries or in heterogeneous landscapes. When a small number of high-quality in-situ samples is added to the map-based training set, predictions become cleaner with sharper field boundaries and more consistent crop assignment.
These examples illustrate that map-based samples alone are not sufficient, but they become extremely valuable when anchored by a limited amount of trusted ground data.
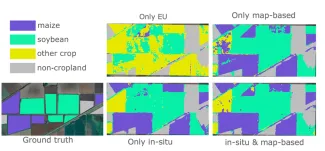
Figure 7: Effect of different training data sources on crop type predictions.
How Much In-Situ Data Is Really Needed?
To further explore this effect, we gradually replaced map-based samples with in-situ samples and monitored model performance (Figures 8 and 9).
At 0% in-situ data, performance is reasonable but sub-optimal. Adding even a small fraction of in-situ data (around 10-30%) leads to a rapid performance increase quickly reaching the upper baseline. Beyond this point, adding more in-situ samples brings little to no additional improvement.
This shows that a relatively small number of high-quality field observations can unlock the full potential of large volumes of map-derived data.
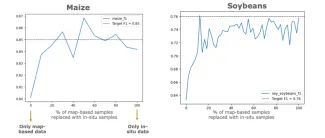
Figure 8: Performance (F1 score) for maize (left) and soybean (right) as map-based samples are progressively replaced by in-situ observations. Dashed lines indicate performance obtained using only in-situ data.
Key Lessons From the Experiments
Our experiments in Argentina illustrate both the strengths and the limitations of using crop maps as training data. While map-derived labels alone can already yield reasonable performance, they tend to miss more complex or ambiguous field situations and may reinforce systematic errors present in the original maps. The results show that combining a large number of map-based samples with even a small set of high-quality, local in-situ observations leads to more robust models. This emphasises the importance of validating models with independent reference data and carefully assessing their transferability across regions or seasons.
In practice, map-based labels do not replace in-situ reference data, but they can significantly reduce the amount of field data needed to reach high model performance. In regions where ground observations are scarce or expensive, this approach offers a practical and scalable path toward more accurate crop type mapping.
Message to Map Producers
Opening up anonymised in-situ reference data that has been used to generate local crop maps is still the preferred action to strengthen global crop mapping efforts like WorldCereal. In practice, however, claims of data confidentiality often hamper such data sharing initiatives. The work presented here showcased that sampling reference data from the resulting maps themselves may represent a valuable alternative. Based on our experiences, we found this can only be accomplished if map producers adhere to the following guidelines:
- Release datasets publicly, with clear terms of use.
- Provide region-specific, per-class accuracy, in particular user's accuracy, so it’s clear which classes can be trusted.
- Clearly specify the validity time of the map: the growing season and year for which it was produced. Without this, maps cannot be used for training crop type models. For instance, in Malaysia we found a rice map that listed a season interval, but it did not match the FAO/USDA crop calendars. Without clarity, it was impossible to know which season the map actually referred to.
- Wherever possible, include pixel-level confidence layers, allowing users to select the most reliable areas.
These are small considerations, but they are a big improvement. They help users integrate crop maps more easily, reduce uncertainty and ensure maps are used to their highest potential. The clearer and more transparent the data, the more powerful its contribution to the global community.
Reflections From an ESA Internship
Working on this project during my six-month internship at the European Space Research Institute (ESRIN), ESA’s centre for Earth observation, in collaboration with VITO and Wageningen Environmental Research, was a very enriching experience. It was an honour to be supervised by experts from these three organisations, who guided me from the very beginning: from setting up the sampling procedure to analysing the results. Being part of an ESA project felt meaningful: I could see how my work contributed to something larger, with real value for the global scientific community.
Technically, the most challenging task was adapting the sampling procedure to very different crop maps. Each dataset contained its own peculiarities: different formats, crop classes, resolutions or accuracy information. There was no "one-size-fits-all" solution, so we had to adjust the workflow each time.
Beyond the technical side, I learned to be more autonomous. Even though my supervisors and collaborators were all in different countries, we managed good communication through weekly meetings and chats. I discovered how important it is to ask precise questions, share progress regularly, and not wait too long if something blocks you. This taught me a lot about teamwork and collaboration across organisations.
ESRIN itself was a great environment: very international, with many events and inspiring people, making me feel part of something bigger.
Looking back, I realise how much I have learned throughout the experience, both technically and personally. This experience also showed me how much I value working on projects that feel meaningful; knowing that my work contributes to a larger goal is very motivating. I also discovered that Earth observation is a stimulating field, and I enjoyed seeing it in practice after mostly studying it in theory at university.
If I could give just one piece of advice to other students, it would be this: don’t worry if the topic feels unfamiliar at the start. I also felt a bit of imposter syndrome at first, but you quickly realise that you can contribute and learn a lot.
References
-
Chen Zhang, Hannah Kerner, Sherrie Wang, Pengyu Hao, Zhe Li, Kevin A. Hunt, Jonathon Abernethy, Haoteng Zhao, Feng Gao, Liping Di, Claire Guo, Ziao Liu, Zhengwei Yang, Rick Mueller, Claire Boryan, Qi Chen, Peter C. Beeson, Hankui K. Zhang, Yu Shen, Remote sensing for crop mapping: A perspective on current and future crop-specific land cover data products, Remote Sensing of Environment, Volume 330, 2025, 114995, ISSN 0034-4257, https://doi.org/10.1016/j.rse.2025.114995.
Join a WorldCereal Training Course
Knowledge supports food security. Interested to participate in one of WorldCereal’s global capacity building events? We have a range of face-to-face training courses, online courses and webinars lined up in 2026. Discover all our upcoming training courses here!